
A guided tour
How Kerkdata works
From data entry to deep analytics — see exactly how the system works.
STEP 01
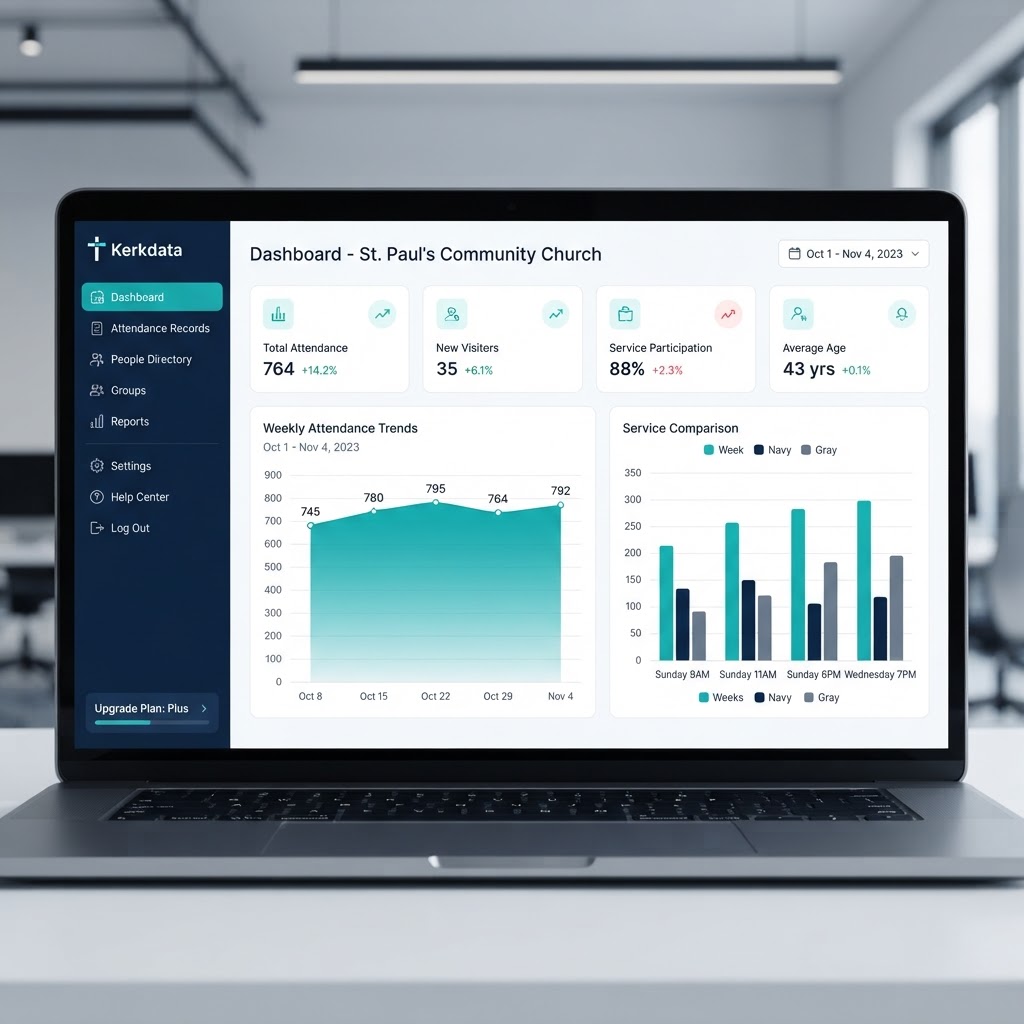
Dashboard & Analytics
See the full picture at a glance
Interactive charts, trend lines, and summary cards give you a real-time view of attendance across every service.
- Weekly & monthly trends
- Service comparison
- On-site vs. streaming
- Year-over-year growth
STEP 02
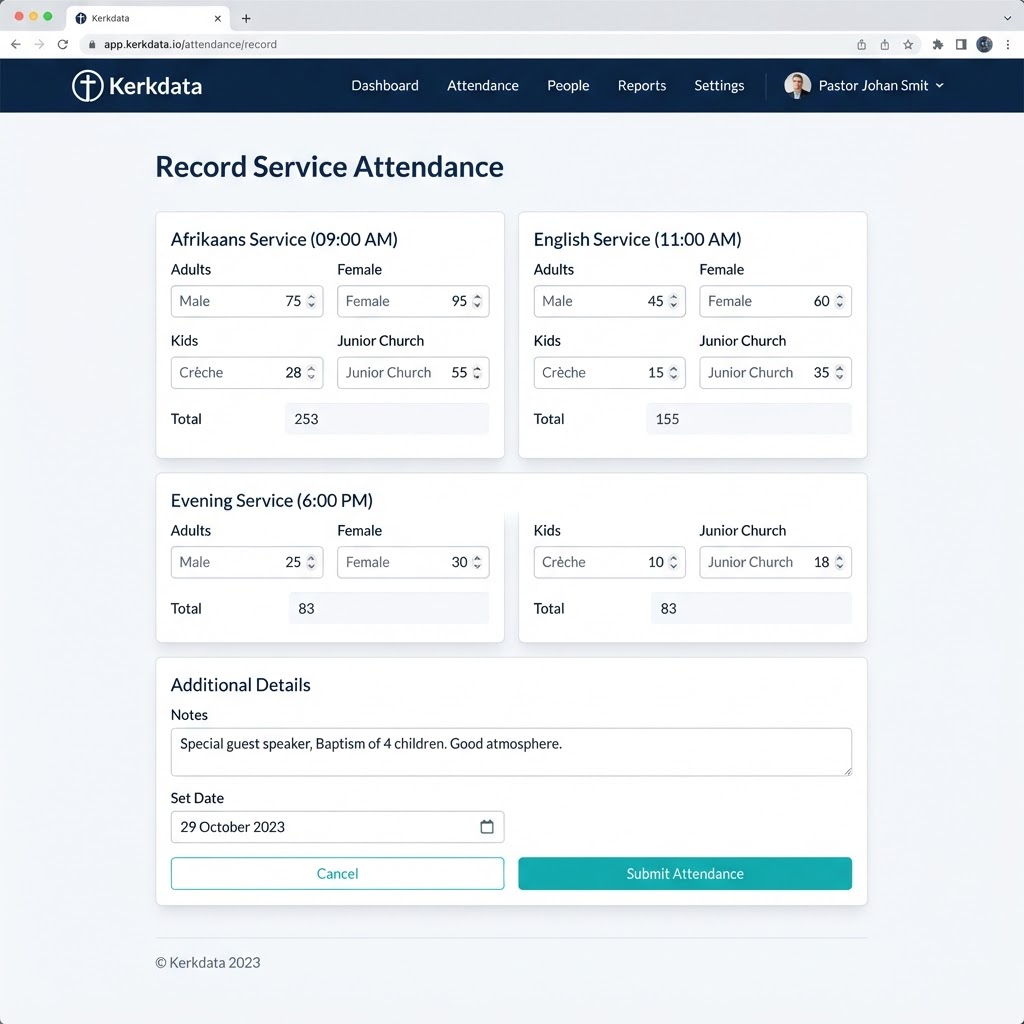
Add Attendance
Capture Sunday in seconds
A simple, guided form lets you enter service numbers. Totals and streaming figures are calculated automatically.
- One form for all services
- Automatic totals
- Kids attendance
- Notes & review flags
STEP 03
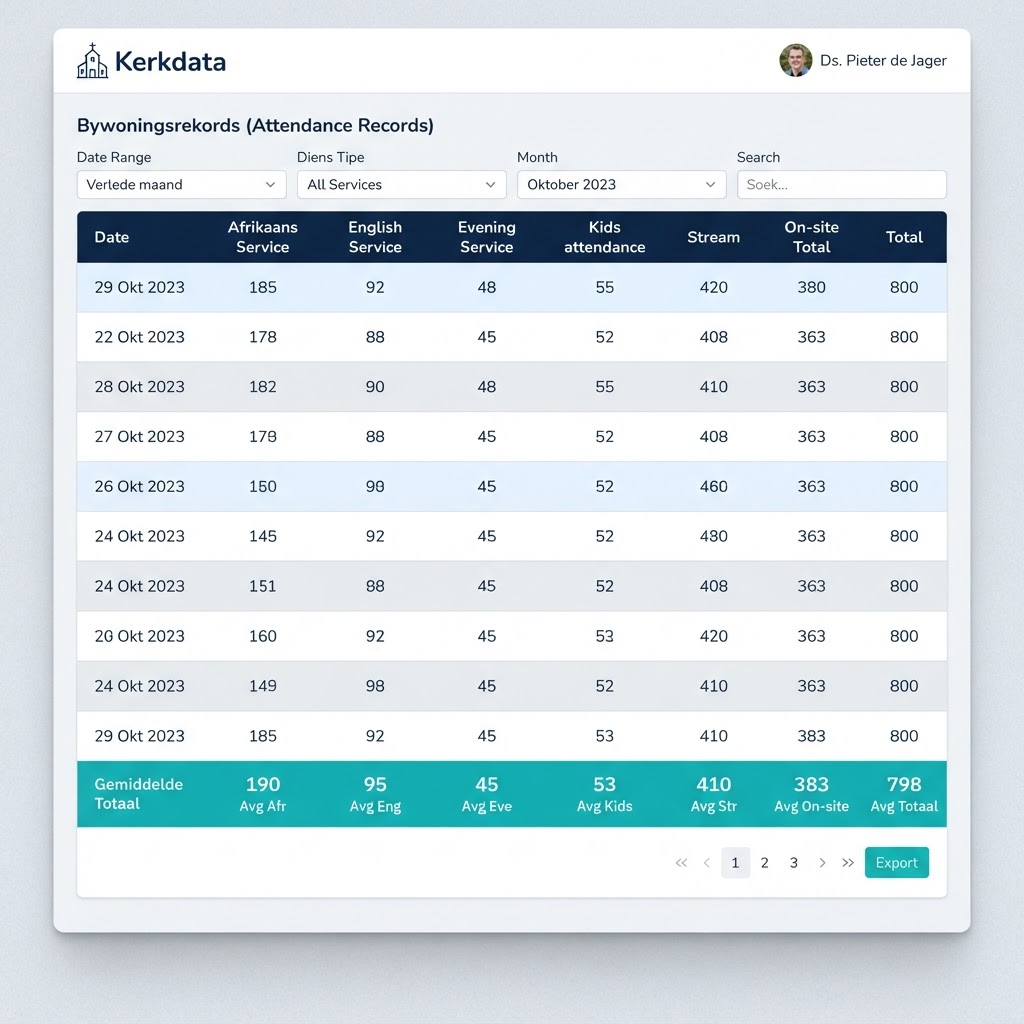
Records Table
Your entire history, searchable
Every Sunday is stored in a clean, filterable database. Search, filter, and export to CSV or PDF.
- Search & filter by date
- Color-coded groups
- Export to CSV or PDF
- Edit & flag records
Ready to see your data differently?
Sign in and start tracking your church attendance with confidence.
Get Started